TL;DR: We fused SuperKMeans and e-means, resulting in 3× faster clustering of high-dimensional vectors without quality trade-offs. Available now at https://github.com/cwida/SuperKMeans.
Recently, there has been a lot of buzz around clustering of vector embeddings: EVōC, SuperKMeans, QGKmeans, and just last week, e-means, o-means, and s-means. Among these, e-means is a big deal: it promises the same quality as Lloyd’s with only 2 epochs. Why is this a big deal for vector search?
Well, clustering is a key building block for large-scale vector indexes (e.g., IVF, ScANN), which is precisely the bottleneck that users have to wait on before issuing similarity search queries.
A year ago, we released SuperKMeans. SuperKMeans accelerates Lloyd’s k-means by 2—10× by avoiding scanning vector dimensions while clustering, without trade-offs in clustering quality. SuperKMeans has been rapidly adopted by industry (ParadeDB, Zilliz, FAISS), showing how timely it is to improve clustering performance for high-dimensional vectors. However, e-means is also exciting because it tackles effort by running fewer epochs. Traditionally, clustering for vector embeddings is standardized to 10 epochs. e-means promises the same (or better) clustering quality with just 2 epochs. I would recommend checking out the wonderful website made by e-means’ authors: https://e-means.github.io/
Interestingly, in their paper, the authors suggest that SuperKMeans’ idea of pruning dimensions is orthogonal to e-means. We agree: there is nothing about these two ideas that opposes the other. Naturally, this put us to work!
The Setup
We have extended our clustering library to implement e-means and SuperEMeans (open-sourced at https://github.com/cwida/SuperKMeans) and have measured their benefits.
The datasets: We will be using two datasets: i) 5M 1536-dimensional OpenAI embeddings from the VectorDBBench benchmark: https://huggingface.co/datasets/makneeee/openai_large_5m. (27 GB). ii) The first 10M MS MARCO passages embedded with the Cohere Embed V3 model (1024-dimensional vectors): https://huggingface.co/datasets/Cohere/msmarco-v2.1-embed-english-v3 (40 GB).
The index: We will build an IVF index with a point-per-cluster ratio of 1:256, resulting in approximately 20,000 centroids for OpenAI and 40,000 centroids for the Cohere dataset.
The setup: For this experiment, I will use a single Zen 5 machine with 16 cores and 128 GB of RAM (r8a.4xlarge | $1.278/hr). However, our SuperKMeans library works on any CPU (e.g., Intel, Graviton, Zen).
The Results
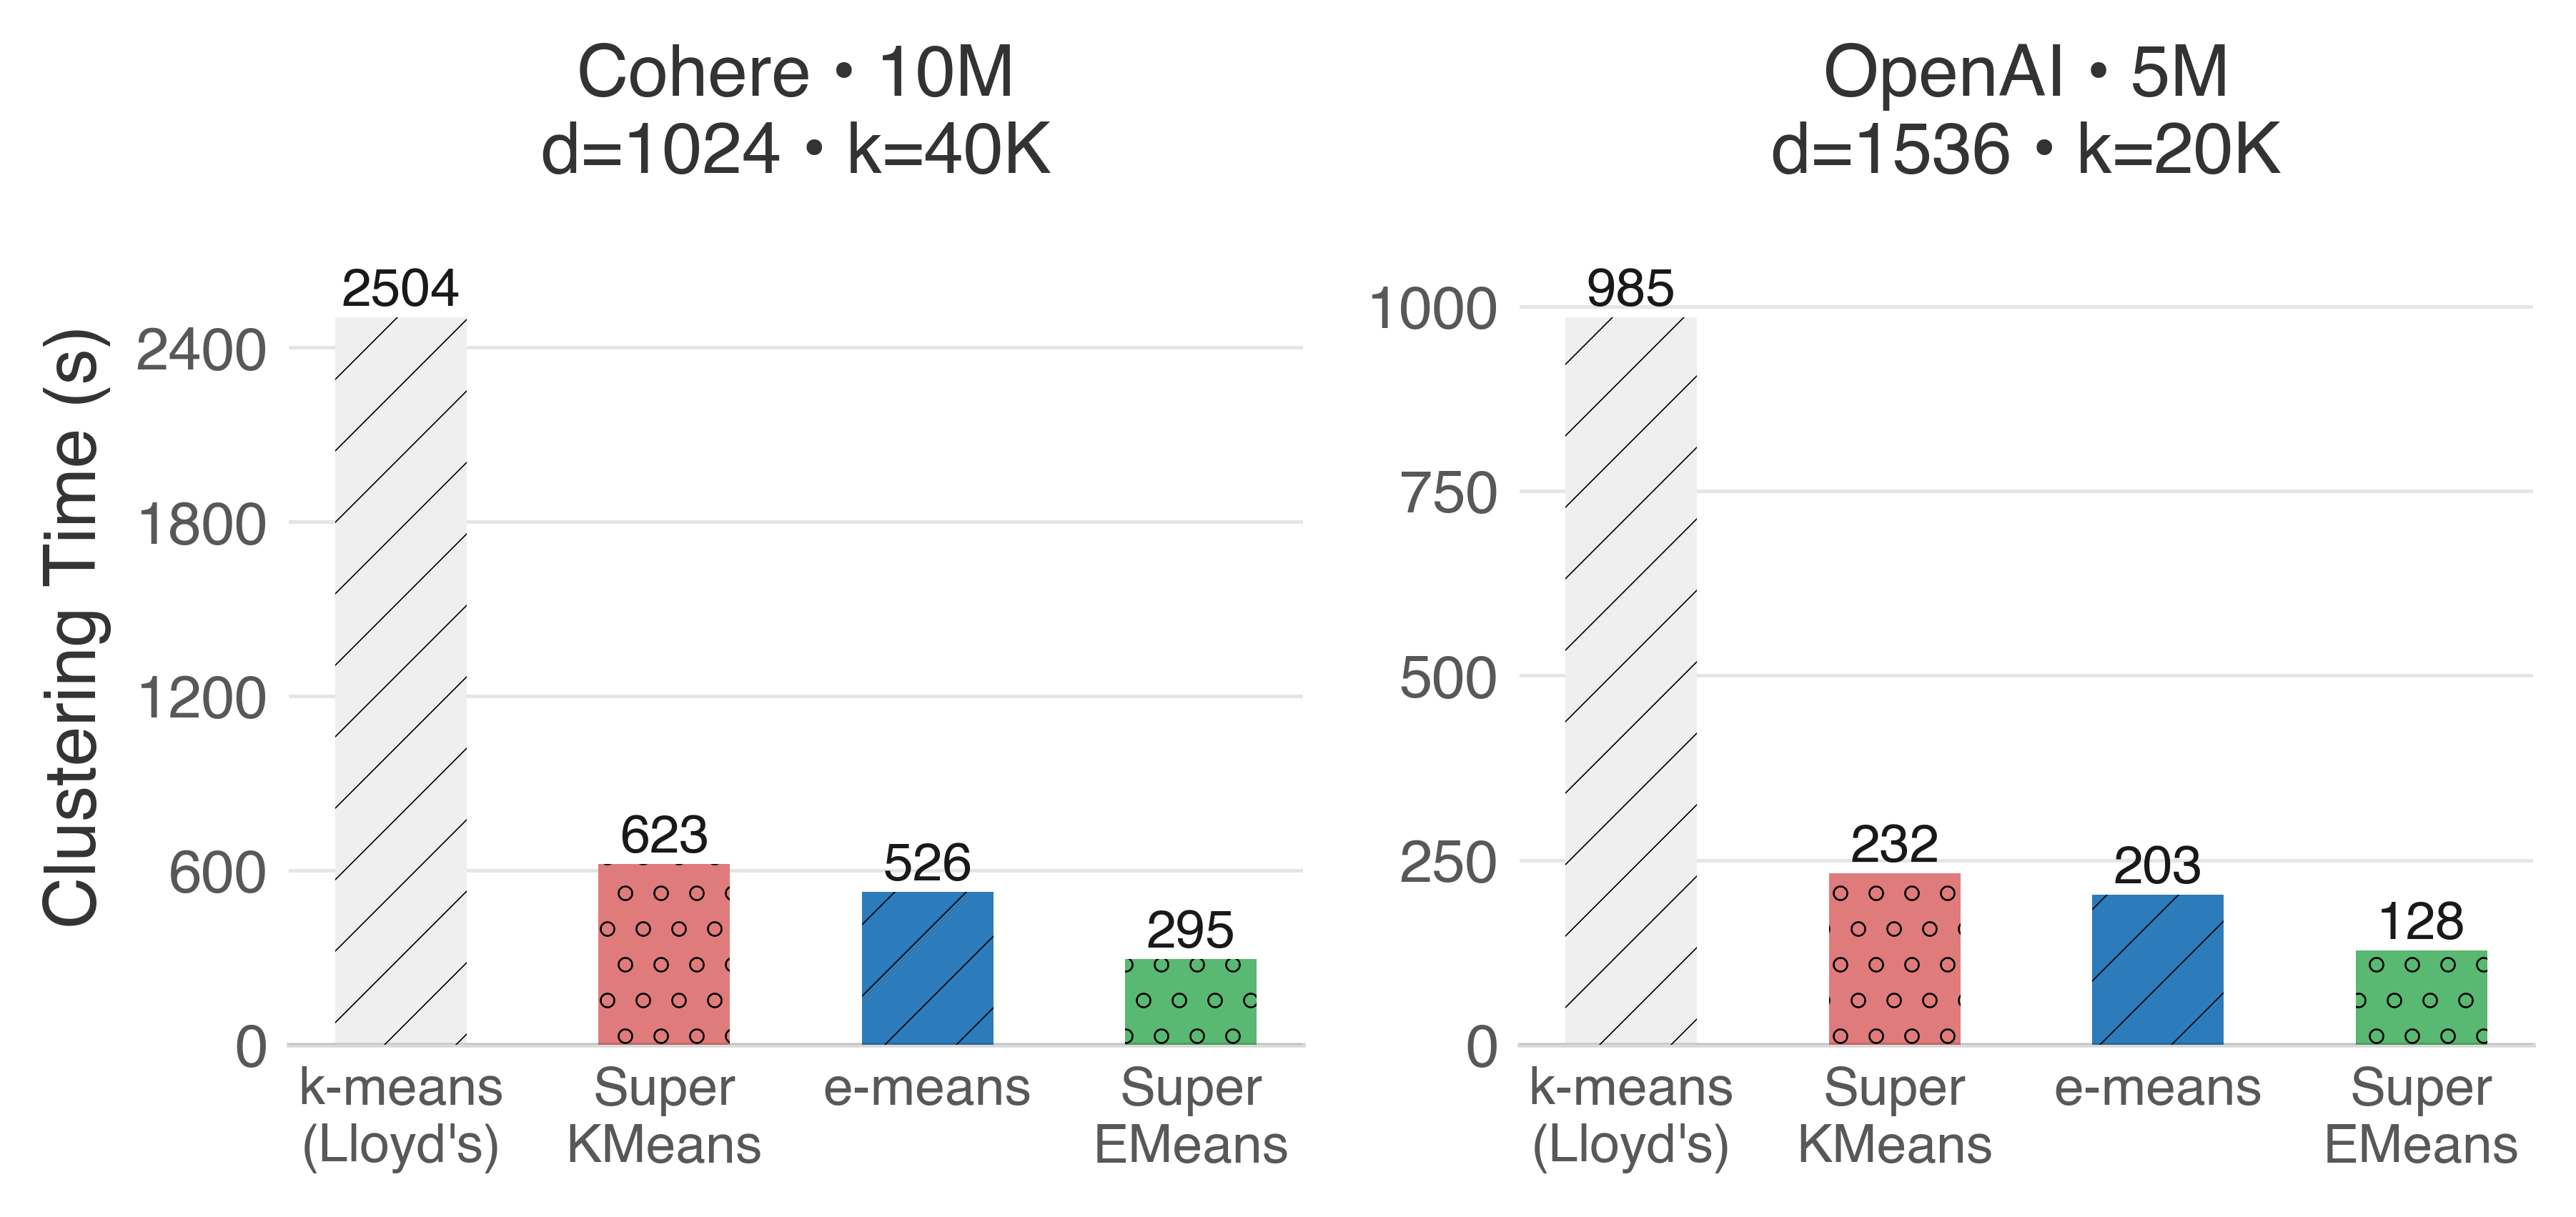
The following plot compares the end-to-end clustering runtime of Lloyd’s (10 iterations), SuperKMeans (10 iterations), e-means (2 epochs), and SuperEMeans (2 epochs). SuperEMeans substantially accelerates e-means, up to 1.8× faster.
But… is it a high-quality index?
Let’s compare the centroids obtained by each approach in terms of how well they perform on vector search tasks. For this analysis, we issue 1000 queries to our IVF index. Then, we measure the proportion of top-100 retrieved results that are in the true top-100 results while scanning 1% of the available clusters (recall@100). We have also compared the balance of clusters by counting the number of distance calculations performed when scanning those clusters. The results for OpenAI are summarized in the table below:
| Algorithm | Runtime (s) | Avg. Recall@100 at 1% of probed centroids | Avg. Vectors scanned at 1% of probed centroids |
|---|---|---|---|
| Lloyd’s k-means (10 iters) | 985 | 0.962 | 52 053 |
| SuperKMeans (10 iters) | 232 | 0.962 | 51 993 |
| e-means (2 epochs) | 203 | 0.967 | 58 184 |
| SuperEMeans (2 epochs) | 128 | 0.967 | 58 198 |
| e-means (2 epochs, author’s implementation) | 333 | 0.967 | 58 111 |
Recall@100 is slightly higher in e-means. However, we end up scanning around 10% more vectors during searches. To match the number of vectors scanned, we have to probe slightly fewer clusters in e-means, around 0.90% of the total clusters. This results in recall@100 = 0.964 while scanning 51,962 vectors, resulting in an ultimately better trade-off than traditional k-means.
The story is the same for Cohere:
| Algorithm | Runtime (s) | Avg. Recall@100 at 1% of probed centroids | Avg. Vectors scanned at 1% of probed centroids |
|---|---|---|---|
| Lloyds k-means (10 iters) | 2504.4 | 0.919 | 112 714 |
| SuperKMeans (10 iters) | 623.3 | 0.919 | 112 547 |
| e-means (2 epochs) | 525.8 | 0.923 | 135 380 |
| SuperEMeans (2 epochs) | 295.3 | 0.923 | 135 463 |
| e-means (2 epochs, author’s implementation) | 927.1 | 0.925 | 136 185 |
Again, we have to probe slightly fewer clusters in e-means, around 0.90% of the total clusters. This results in recall@100 = 0.918 while scanning 121,511 vectors. Here, the gap is not favorable for e-means, which scans 8% more vectors for the same recall.
Why does e-means scan more vectors?
In e-means, clusters are more bloated than in Lloyd’s k-means in the regions of the vector space queried most often. Yet e-means reaches a lower WCSS (MSE), since that objective doesn’t reward balanced clusters, while vector search pays for every point it scans. Note that the cost is latency at a fixed number of probed clusters, not retrieval quality (since matching the number of vectors scanned yields roughly the same recall).
As for the algorithmic reason why, the imbalance comes from e-means’ mini-batch updates. A cluster that gains just a few points in the initial batches stays with just a few points for the rest of the clustering.
To counteract this, e-means introduces a revival step that, every five batches, re-seeds clusters whose usage in a batch fell below 0.1× the mean usage across clusters. If this happens, that cluster is eliminated and a large cluster is split into two. We found this threshold too conservative, leaving many small clusters stuck with few points across batches. Raising the revival threshold from 0.1 to 0.3 brings cluster balance and scan cost closer to Lloyd’s level in the Cohere dataset.
| Algorithm | Avg. Recall@100 at 1% of probed centroids | Avg. Vectors scanned at 1% of probed centroids |
|---|---|---|
| k-means (10 iters) | 0.919 | 112 714 |
| e-means (2 epochs, revival t=0.1) | 0.923 | 135 380 (1.20× higher) |
| e-means (2 epochs, revival t=0.3) | 0.918 | 119 548 (1.06× higher) |
More Epochs
At 5 epochs (the author’s default in their implementation), the speedup from SuperEMeans is remarkable: up to 3× faster!
| Cohere | Runtime (s) | Avg. Recall@100 at 1% of probed centroids | Avg. Vectors scanned at 1% of probed centroids |
|---|---|---|---|
| e-means (5 epochs) | 1283 | 0.927 | 136 212 |
| SuperEMeans (5 epochs) | 436 (3× faster) | 0.927 | 136 191 |
| OpenAI | Runtime (s) | Avg. Recall@100 at 1% of probed centroids | Avg. Vectors scanned at 1% of probed centroids |
|---|---|---|---|
| e-means (5 epochs) | 513 | 0.968 | 58 078 |
| SuperEMeans (5 epochs) | 162 (3.2× faster) | 0.968 | 58 086 |
Closing Remarks
e-means is an interesting advancement in clustering algorithms. I would love to see more advancements that pay attention to cluster balance. This is a key factor for vector search performance that doesn’t necessarily align with the WCSS / MSE objective of k-means.
Anyways, I am excited to see where we go from here! As the authors also mention in their paper, approximate assignment can accelerate large-scale clustering (+1B points), where even 1 epoch can cost hours. In our library, we implement hierarchical k-means, which has also seen success on vector-embedding datasets (implemented in NVIDIA’s cuVS library). However, it didn’t work quite well with e-means. I suspect this might also be due to how cluster’s revival works.
Another option is to cluster quantized vectors. For example, quantize 32-bit floats to 8-bit integers, or 1-bit RaBitQ codes before clustering. We have explored this in another research paper with remarkable results.
SuperKMeans and e-means detailed technical reports are available on arXiv.
Reproducibility
The source code to reproduce the results of this blog post are available at: https://github.com/lkuffo/reproducibility-superemeans